
The Crazy World of College Presidential Salaries Part 3: Comparing Presidential Salaries with State College & University Success Rates
While many factors influence state university presidential pay rates, there isn’t always a correlation between those rates and student outcomes. Ideally, a university president would have a portion of his or her salary tied to student outcomes such as improved retention and graduation rates. To see how Massachusetts state colleges and universities stack up, we reviewed the Massachusetts Department of Higher Education online data tool.
Graduation Rates
Figure 1 below depicts each state college and university’s latest four- and six-year graduation rates. This data describes the 2009 cohort of students, i.e. those entering the school in the fall of 2009. Had they completed their studies in four years they would have graduated in 2013, and would have graduated in 2015 if it took six years.
Figure 1 [i]
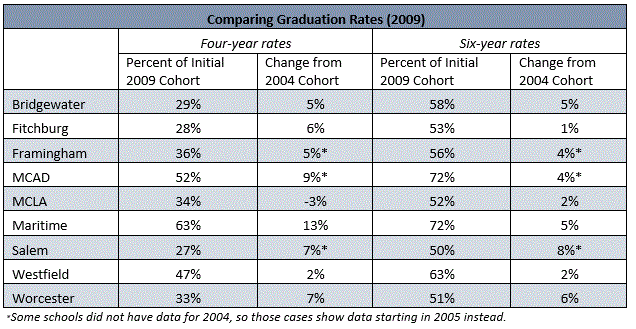
Massachusetts Maritime Academy and Massachusetts College of Art and Design (MCAD or MassArt) have both the highest four- and six-year graduation rates. Salem and Bridgewater have two of the lowest four-year rates. The Massachusetts College of Liberal Arts’ (MCLA) four-year graduation rates have dropped over the past few years and six-year graduation rates have increased only marginally.
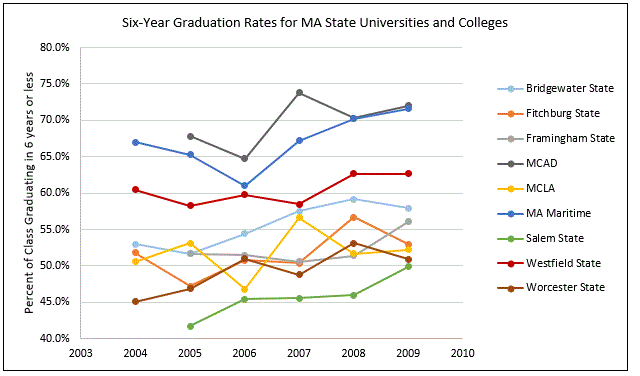
But these latest figures on each institution’s graduation rates don’t tell the whole story; some schools have seen a lot of fluctuation over the past few years. For example, Figure 2 shows each school’s six-year graduation rates from cohorts starting college in 2004 through those entering in 2009. MassArt (MCAD) shows a great deal of change—the rate of students graduating from the 2007 cohort was nearly 10 percentage points higher than those in the 2006 cohort (dark grey). Massachusetts College of Liberal Arts (yellow) saw a near 10 percentage point spike during this period as well, followed by a 5 percent decrease the following year. Overall, six-year graduation rates for the 2009 cohorts were higher than for 2004 cohorts at each state college and university. Salem State remains at the bottom of the pack, despite making an 8.2 percentage point jump in graduation rates over this period. The highest graduation rates among the 2009 cohorts were at MassArt and Massachusetts Maritime Academy.
Figure 2 [ii]
Student Retention Rates
School performance is also measured by first-year retention rates, which track how many full-time students who enter as freshmen return for their second year. While graduation date for any individual student may vary for a number of reasons, retention of first-years is indicative of the school’s ability to adequately serve students.
Figure 3 [iii]
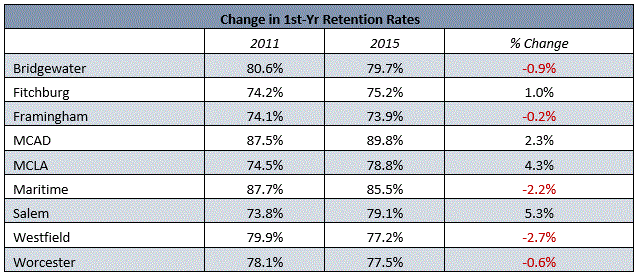
As seen in red, the majority of MA’s state universities and colleges have seen retention decline since 2011. On the other hand, Salem State saw a 5.3 percent increase in retention during the period.
Comparing Performance to Presidential Salaries
So how do these performance metrics compare with escalating presidential salaries (see Part 1 and Part 2 of this blog series) and should a president’s salary steadily increase if retention and graduation rates are not?
Some presidents, including those from Bridgewater, Framingham, Fitchburg, Massachusetts College of Liberal Arts, Salem, and Worcester, all have comparatively higher salaries and lower retention rates than other state universities. Schools like Massachusetts Maritime Academy and Massachusetts College of Art and Design have been relatively successful at retaining high numbers of their students (85 percent and above), and also spend less on administrative costs such as presidential salaries (less than $200,000 annually). However, while retention rates are one benchmark of success, they do not tell the whole story.
To see an overview of how performance measures line up with presidential salaries, Figure 4 shows 2015 salary, graduation, and retention rates as a snapshot of how each of the nine state college and universities stack up.
Figure 4 [iv]
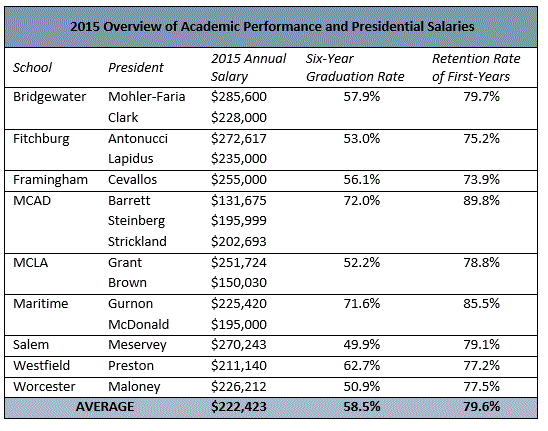
Each of the state colleges and universities listed above has seen positive trends in six-year graduation rates. Salem State University has had the most growth since 2010, with a more than 8 point increase in the percentage of students graduating within six years. Retention has not been so steady. Four of the nine institutions (Fitchburg State, MassArt, Massachusetts College of Liberal Arts, and Salem) have had increases in retaining students from their first to second years. The rest (Bridgewater State, Framingham State, Mass Maritime Academy, Westfield State, and Worcester State) have seen overall decreases in the number of students who return after their first year.
Comparing performance to results – even looking at basic statistics like graduation and retention rates – is a complex exercise. Presidents of some schools with lower rates are paid more than their colleagues at institutions that perform better as measured by these metrics.
What is clear is that presidential salaries do not directly correlate to student outcomes. The question is, should they?
Endnotes
[i] Four, Five, and Six Year Graduation Rate for First-time Full-time Baccalaureate Degree seeking Freshman Cohort, Massachusetts Department of Higher Education. http://www.mass.edu/datacenter/success/SUAppendix456GradRate.asp
[ii] Four, Five, and Six Year Graduation Rate for First-time Full-time Baccalaureate Degree seeking Freshman Cohort, Massachusetts Department of Higher Education. http://www.mass.edu/datacenter/success/SUAppendix456GradRate.asp
[iii] First-Year Retention Rate (Fall to Fall) New First-Time, Full-time Degree-Seeking Students, Massachusetts Department of Higher Education. http://www.mass.edu/datacenter/success/SUFirstYrRetention.asp
[iv] Data compiled from Massachusetts Department of Higher Education and Comptroller of the Commonwealth Open Payroll Data

