
Fewer Employees, More Space: DCAMM’s Leasing Strategy
For most public and private entities, space is the second-largest administrative cost, after personnel. Discussion of personnel costs often overshadows other administrative cost debates in the public sector, but policymakers should strive to ensure that space is used as effectively as possible, to maximize the value for taxpayers.
All states utilize a combination of owned and leased spaces to satisfy their facility needs. Owned properties include all kinds of land and buildings, while leased properties are mostly office space. As of 2015, Massachusetts leases just over 7.2 million square feet of space, primarily office space, which it occupies in addition to its own facilities.[1] This is above average among New England states when analyzed on a gross square footage (GSF) per state employee basis, as shown in the table below. A 1997 report from the federal General Services Administration remarks that, “all organizations use some type of square foot per person measure,” and GSF per employee is widely regarded as a standard measure of office space. GSF data for Rhode Island were not publicly available.
| GSF Leased Space | 2014 State Employees[2] | GSF Per Employee | |
| Connecticut[3] | 2,802,142 | 53,662 | 52.22 |
| New Hampshire[4] | 720,012 | 14,694 | 71.39 |
| Vermont[5] | 1,044,281 | 13,289 | 78.58 |
| Massachusetts | 7,236,034 | 87,699 | 82.51 |
| Maine[6] | ~1,600,000 | 18,602 | 86.01 |
As can be seen, Massachusetts nearly leads New England in leased square footage per employee. In a nationwide comparison, Massachusetts’ status as an outlier is even more apparent. Texas, for instance, maintains a ratio of just 37.91 GSF leased per employee. These numbers make clear that Massachusetts is leasing an amount of office space higher than what we would expect for a state with its number of employees. Is leasing this much space an effective way to satisfy the state’s facility needs?
Leasing office space indeed has some advantages over operating state-owned office buildings. Leases are more flexible, allowing for faster change in space size as the state workforce grows or contracts. Leases are also less costly in the short term, providing an incentive for cash-strapped agencies to lease space, rather than seek funds for state offices, though state-owned buildings are less expensive in the long run.
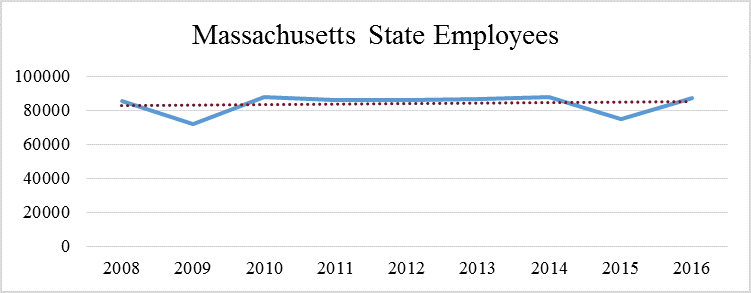
However, even as the state workforce has remained steady over the past 7 years, the amount of office space leased by the state has grown considerably. As can be seen below, the red dotted trend line in state employment from 2009 to 2016 is effectively flat, with employment hovering just over 87,000. The blue line tracks annual employment numbers for that period.
Despite this stasis in employment, in 2015 the Department of Capital Asset Management and Maintenance (DCAMM) reported that the Commonwealth leased 7,236,034 gross square feet of space, a more than 6 percent increase from the 6,814,864 GSF of leased space reported in 2009.[7] From 2010 to 2015, the number of state employees declined from 87,920 to 87,256, a decrease of 0.7 percent. These numbers force us to ask: why is leased space increasing?
The increase in leased square footage, without an uptick in employment, directly translates to Massachusetts’s high GSF to employee ratio. DCAMM employees have remarked that this move toward leased space is a concerted, long-term effort by the department; Pioneer is pursuing a public records request for documents that will shed more light on this shift. We look forward to analyzing the costs and benefits to the people of Massachusetts.
[1] 2015 DCAMM ‘Massets’ Report
[2]U.S. Bureau of the Census: 2014 Annual Survey of Public Employment and Payroll
[3] Connecticut 2016 Inventory of Real Property
[4] New Hampshire 2015 Inventory of Executive Branch Operating Leases
[5] The Vermont Space Book: 2015
[6] Maine Division of Real Property Website
[7] 2009 DCAMM ‘Massets’ Report

